Google Capstone: Cyclistic
This case study, part of the Google Data Analytics Certificate, delves into the historical trip data of Cyclistic, a Chicago-based bike-share company. With over 5,824 bicycles and 692 docking stations, including inclusive options for people with disabilities, Cyclistic aims to convert casual riders into annual subscription members. The analysis focuses on providing insights into user preferences, habits, and goals to enhance the marketing team's strategies.
Projet Details
Utilizing third-party public data sets from the city of Chicago's Divvy system and Motivate International Inc., I aim to uncover trends crucial for the marketing team's decision-making. The roadmap follows Google's data analysis process, encompassing six phases: Ask, Prepare, Process, Analyze, Share, and Act.
Roadmap
1. Phase: Ask
The primary goal is to convert casual riders into annual members without launching a new marketing campaign. Key stakeholders include Lily Moreno (Director of Marketing), the Marketing analytics team, and the Executive Team. SMART questions guide the analysis, focusing on understanding user behavior and preferences.
- Key Tasks
- [X] Identify the business task.
- [X] Consider key stakeholders.
- Deliverable
- [X] A clear statement of the business task.
2. Phase: Prepare
Cyclistic's historical trip data, sourced from Divvy Bikes, is stored securely. The data is comprehensive, reliable, and does not compromise user privacy. It offers insights into bike types, usage frequency, and trip duration. Despite some formatting issues, the data's integrity is validated, laying the foundation for meaningful analysis.
Imported six months data
# April 2021 dataset.
# tripApr_2021 <- read_csv("~/R/Git_HUB/casestudy_repos/Google Capstone/marcella-s_portfolio/marcellaharris.github.io/Google Capstone Project/2021Apr-divvy-tripdata.csv",
#                          col_types = cols(started_time = col_time(format = "%H:%M:%S"),
#                                           ended_time = col_time(format = "%H:%M:%S"),
#                                           ride_length = col_time(format = "%H:%M:%S")))
# # May 2021 dataset.
# tripMay_2021 <- read_csv("~/R/Git_HUB/casestudy_repos/Google Capstone/marcella-s_portfolio/marcellaharris.github.io/Google Capstone Project/2021May-divvy-tripdata.csv",
#                          col_types = cols(started_time = col_time(format = "%H:%M:%S"),
#                                           ended_time = col_time(format = "%H:%M:%S"),
#                                           ride_length = col_time(format = "%H:%M:%S")))
# # June 2021 dataset.
# tripJun_2021 <- read_csv("~/R/Git_HUB/casestudy_repos/Google Capstone/marcella-s_portfolio/marcellaharris.github.io/Google Capstone Project/2021Jun-divvy-tripdata.csv",
#                          col_types = cols(started_time = col_time(format = "%H:%M:%S"),
#                                           ended_time = col_time(format = "%H:%M:%S"),
#                                           ride_length = col_time(format = "%H:%M:%S")))
# # July 2021 dataset.
# tripJul_2021 <- read_csv("~/R/Git_HUB/casestudy_repos/Google Capstone/marcella-s_portfolio/marcellaharris.github.io/Google Capstone Project/2021Jul-divvy-tripdata.csv",
#                          col_types = cols(started_time = col_time(format = "%H:%M:%S"),
#                                           ended_time = col_time(format = "%H:%M:%S"),
#                                           ride_length = col_time(format = "%H:%M:%S")))
# # August 2021 dataset.
# tripAug_2021 <- read_csv("~/R/Git_HUB/casestudy_repos/Google Capstone/marcella-s_portfolio/marcellaharris.github.io/Google Capstone Project/2021Aug-divvy-tripdata.csv",
#                          col_types = cols(started_time = col_time(format = "%H:%M:%S"),
#                                           ended_time = col_time(format = "%H:%M:%S"),
#                                           ride_length = col_time(format = "%H:%M:%S")))
# # September 2021 dataset.
# tripSep_2021 <- read_csv("~/R/Git_HUB/casestudy_repos/Google Capstone/marcella-s_portfolio/marcellaharris.github.io/Google Capstone Project/2021Sep-divvy-tripdata.csv",
#                          col_types = cols(started_time = col_time(format = "%H:%M:%S"),
#                                           ended_time = col_time(format = "%H:%M:%S"),
#                                           ride_length = col_time(format = "%H:%M:%S")))
- Key Tasks
- [X] Download data and store it appropriately.
- [X] Identify how it’s organized.
- [X] Sort and filter the data.
- [X] Determine the credibility of the data.
- Deliverable
- [X] A description of all data sources used.
3. Phase: Process
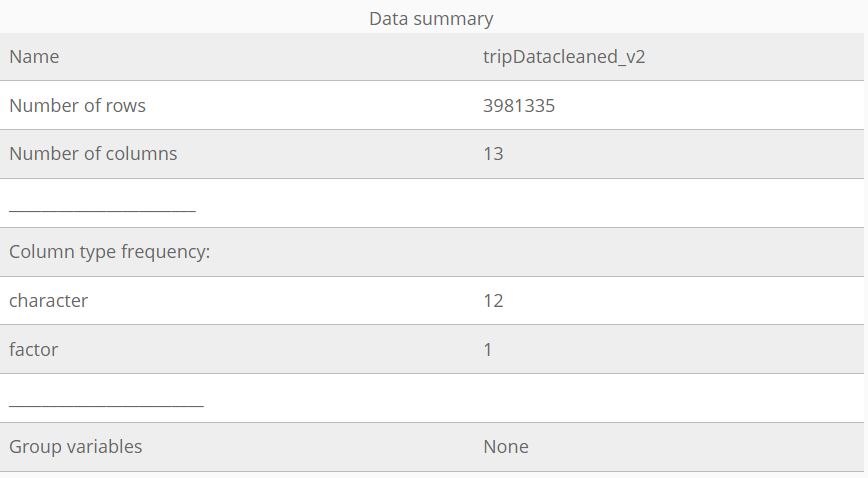
The data is processed using Excel for formatting, R-Studio for cleaning and calculations, and Tableau for visualizations. The cleaning process involves trimming, renaming, filtering, sorting, and merging data frames. While facing some formatting challenges, the focus remains on maintaining data integrity.
Output
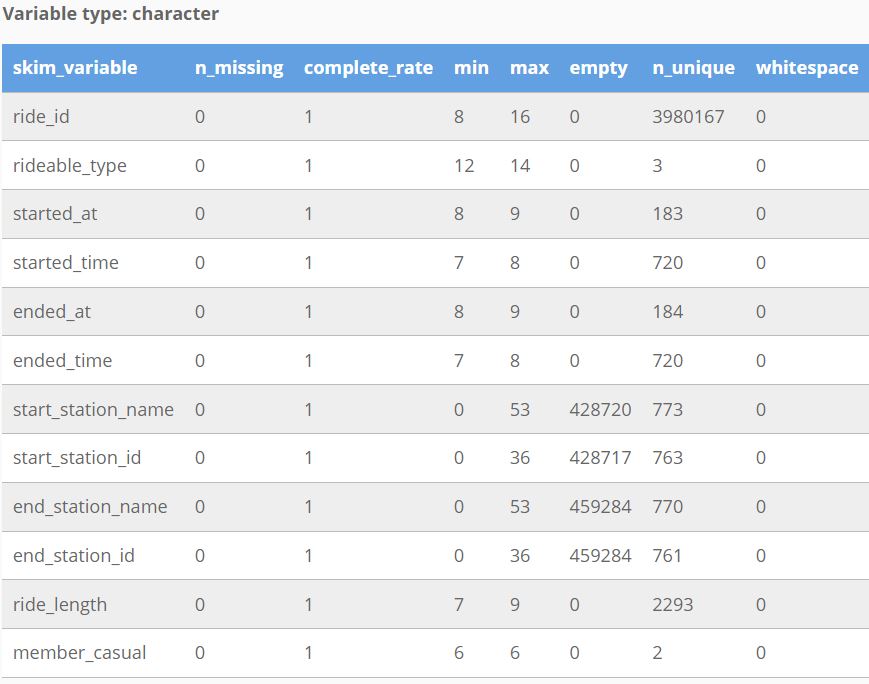
## tibble [3,981,367 x 13] (S3: tbl_df/tbl/data.frame)
## $ ride_id : chr [1:3981367] "6C992BD37A98A63F" "1E0145613A209000" "E498E15508A80BAD" "1887262AD101C604" ...
## $ rideable_type : chr [1:3981367] "classic bike" "docked bike" "docked bike" "classic bike" ...
## $ started_at : chr [1:3981367] "4/12/2021" "4/27/2021" "4/3/2021" "4/17/2021" ...
## $ started_time : chr [1:3981367] "6:25:00" "5:27:00" "12:42:00" "9:17:00" ...
## $ ended_at : chr [1:3981367] "4/12/2021" "4/27/2021" "4/7/2021" "4/17/2021" ...
## $ ended_time : chr [1:3981367] "6:56:00" "6:31:00" "11:40:00" "9:42:00" ...
## $ start_station_name: chr [1:3981367] "State St & Pearson St" "Dorchester Ave & 49th St" "Loomis Blvd & 84th St" "Honore St & Division St" ...
## $ start_station_id : chr [1:3981367] "TA1307000061" "KA1503000069" "20121" "TA1305000034" ...
## $ end_station_name : chr [1:3981367] "Southport Ave & Waveland Ave" "Dorchester Ave & 49th St" "Loomis Blvd & 84th St" "Southport Ave & Waveland Ave" ...
## $ end_station_id : chr [1:3981367] "13235" "KA1503000069" "20121" "13235" ...
## $ ride_length : chr [1:3981367] "0:31:00" "1:04:00" "94:58:00" "0:25:00" ...
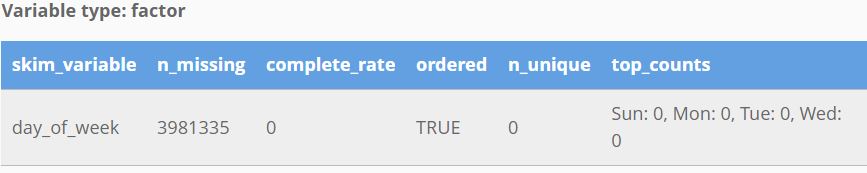
## $ day_of_week : int [1:3981367] 2 3 7 7 7 1 7 3 2 7 ...
## $ member_casual : chr [1:3981367] "member" "casual" "casual" "member" ...
- Key Tasks
- [X] Check the data for errors.
- [X] Choose your tools.
- [X] Transform the data so you can work with it effectively.
- [X] Document the cleaning process.
- Deliverable
- [X] Documentation of any cleaning or manipulation of data.
4. Phase: Analyze
The organized data reveals surprising insights, such as casual riders having longer ride lengths and more docked bikes. Key trends, like the higher number of members and their fewer ride times, help tell the story of Cyclistic's two rider types, uncovering reasons why casual riders aren't becoming annual subscribers.
- Key Tasks
- [X] Aggregate your data so it’s useful and accessible.
- [X] Organize and format your data.
- [X] Perform calculations.
- [X] Identify trends and relationships.
- Deliverable
- [X] A summary of your analysis.
5. Phase: Share
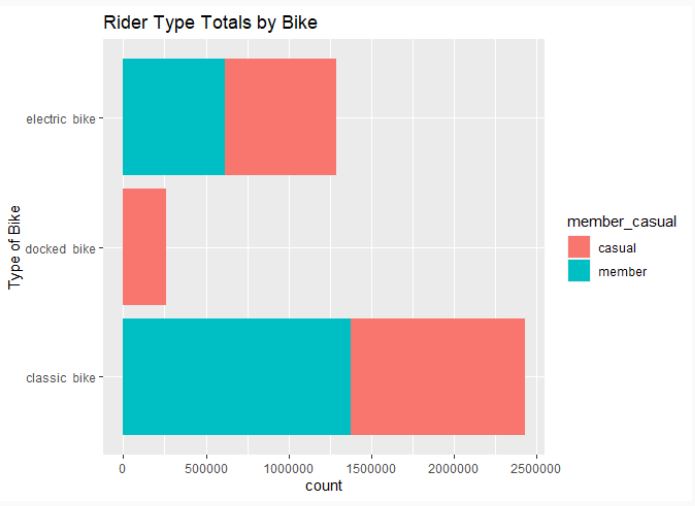
Insights are shared through data visualization, answering questions about how casual riders differ from annual members. Weekend preferences for casual riders and weekday use for members highlight distinctions in user purposes. The audience, including the marketing director and analytics team, benefits from a PowerPoint presentation summarizing findings and recommendations.
# Rider Type Totals by Bike
ggplot(tripDatacleaned_v2, aes(rideable_type, fill=member_casual)) +
  geom_bar() +
  labs(x="Type of Bike", title="Rider Type Totals by Bike") +
  coord_flip()
- Key Tasks
- [X] Determine the best way to share your findings.
- [X] Create effective data visualizations.
- [X] Present your findings.
- [X] Ensure your work is accessible.
- Deliverable
- [X] Supporting visualizations and key findings.
6. Phase: Act
The conclusion emphasizes that casual riders prefer classic bikes on weekends, while members use them steadily throughout the week. Recommendations include focus groups for casual riders and a referral-based rewards program. Further steps involve gathering additional data and conducting in-depth analyses, such as surveys on docking station preferences and user demographics.
- Key Tasks
- [X] Create your portfolio.
- [X] Add your case study.
- [X] Practice presenting your case study to a friend or family member.
- Deliverable
- [X] Your top high-level insights based on your analysis.
- [X] Based on what you discover, a list of additional deliverables you think would be helpful to include for further exploration.
This analysis provides Cyclistic's executive team with actionable insights to enhance their strategies and better cater to the needs of both casual riders and annual subscribers. Well I hope you've enjoyed the read and thanks for stopping by!
 I used R-Studio from Posit as my IDE and to export the html page.