Greetings and salutations to you all!

Step into the captivating world of data wizardry! Whether you're a tech enthusiast or a seasoned pro, join me on a journey where analytics meets artistry, unlocking the magic of insights and stories woven from the threads of data.

Currently Working On...

Favorita Store Sales


Insights and time-series forcasting on major supermarket corporations based in South America.

Continue reading
Your Image Alt Text

Sprightly Homeschool

Nov 11

Built a fully functional website for my homeschooled daughter, utilizing MySQL to store, organize, and run daily queries.

Continue reading
Your Image Alt Text

From the Firehose

Analysis

My analysis provides key insights into the condition and management of street trees in the area. Firstly, tree diameters are primarily concentrated between 50 and 60 inches, with a notable number of outliers that may stem from human error or environmental impacts. This suggests potential issues with data collection or external factors influencing tree growth

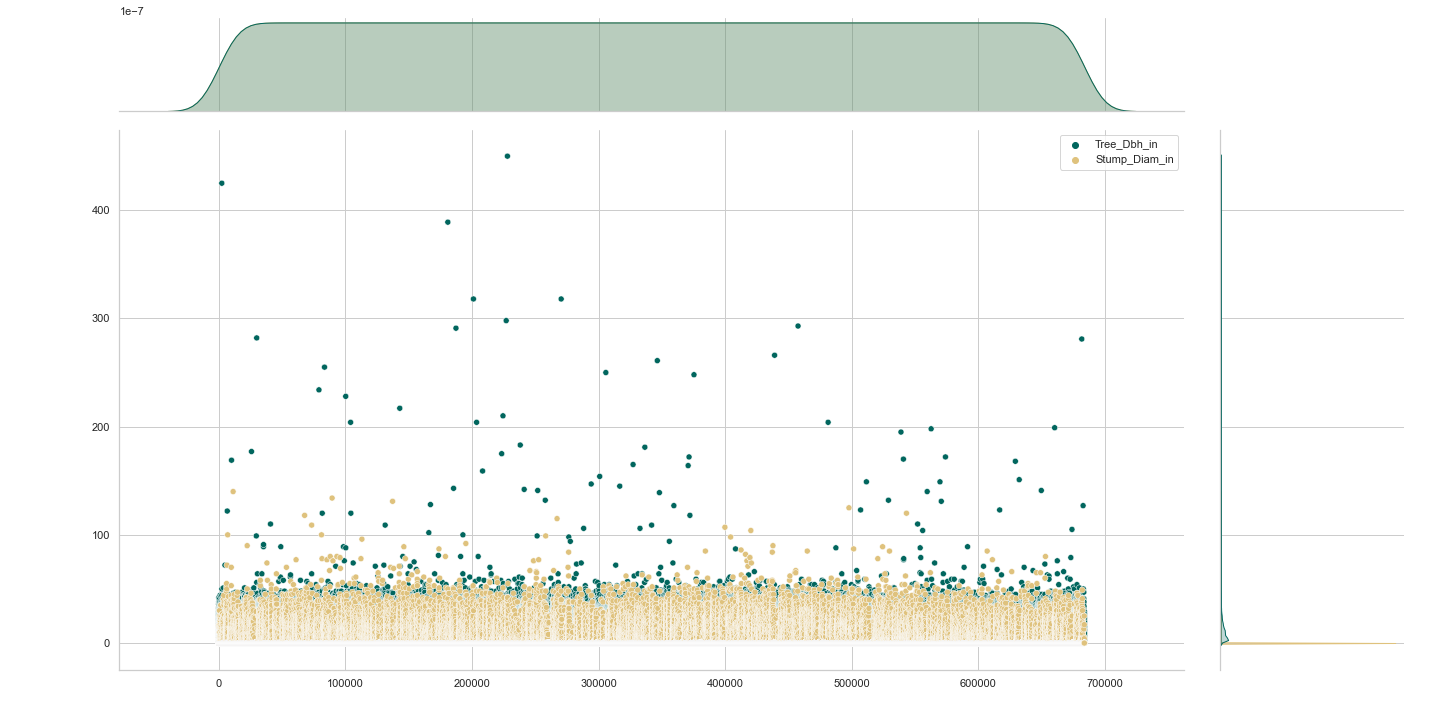
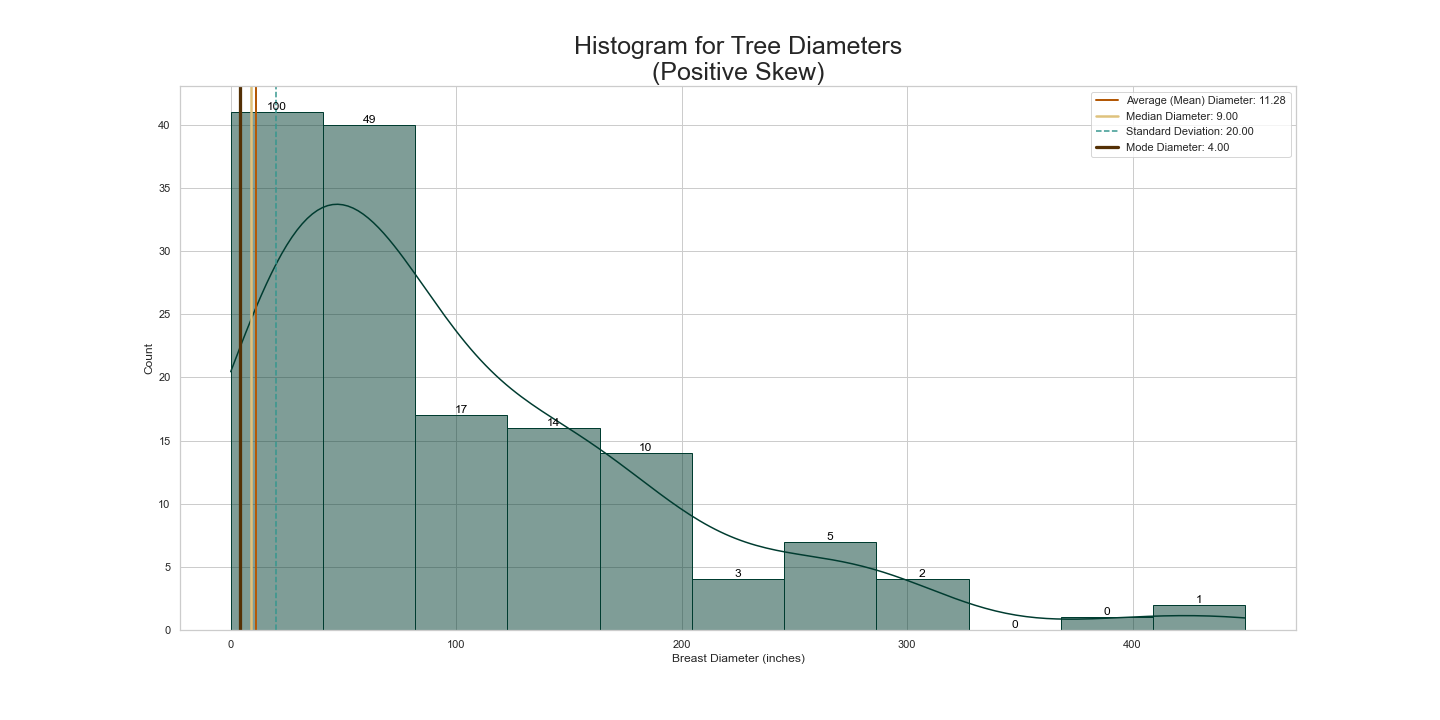
Secondly, the mean diameter at breast height for street trees is 11.28 inches, with a median of 9 inches, indicating a wide range of tree sizes. The large standard deviation of 20 further emphasizes variability in tree size across New York City. Additionally, the median tree diameter of 12 inches is notably higher than the median stump diameter of 3 inches, indicating that the city's trees are generally larger and older than their stumps.

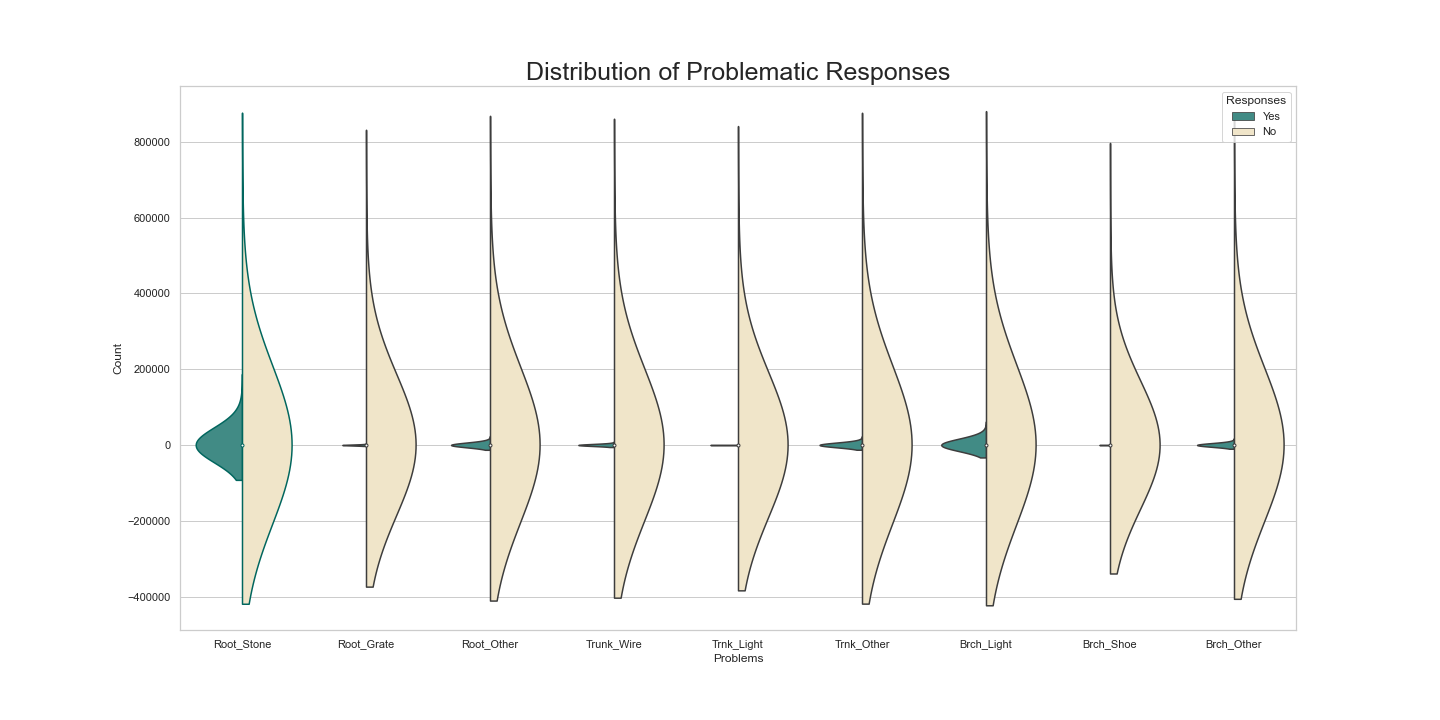
Thirdly, survey responses reveal that the majority of surveyors reported 0-2 problems with street trees, with greater variance in responses reporting higher numbers of problems. This suggests potential issues with tree roots affecting their health and vitality.

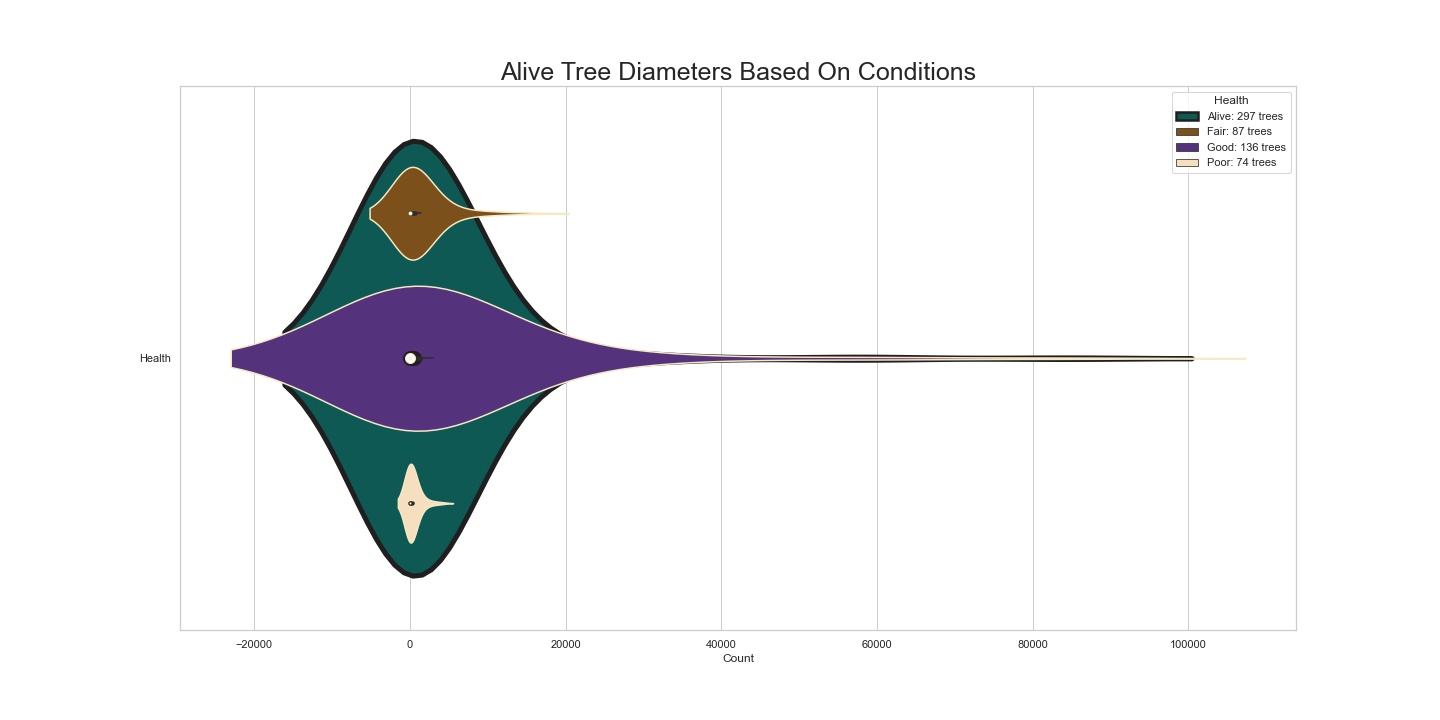
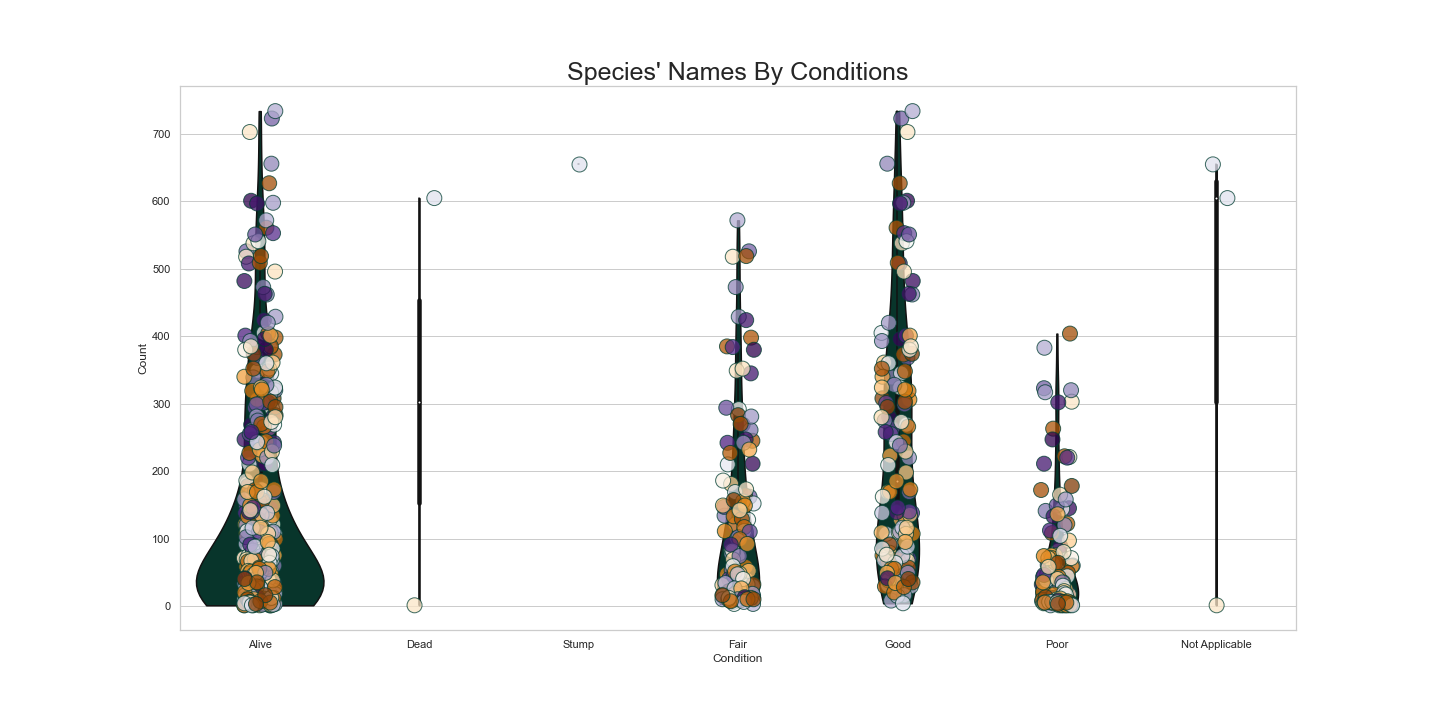
Fourthly, although the majority of trees in the city are in good health and labeled as "Alive," there is a need for improvement in the management and care of trees in "Fair" and "Poor" condition. The data suggests potential root issues in these trees that need addressing to ensure their survival and long-term health.

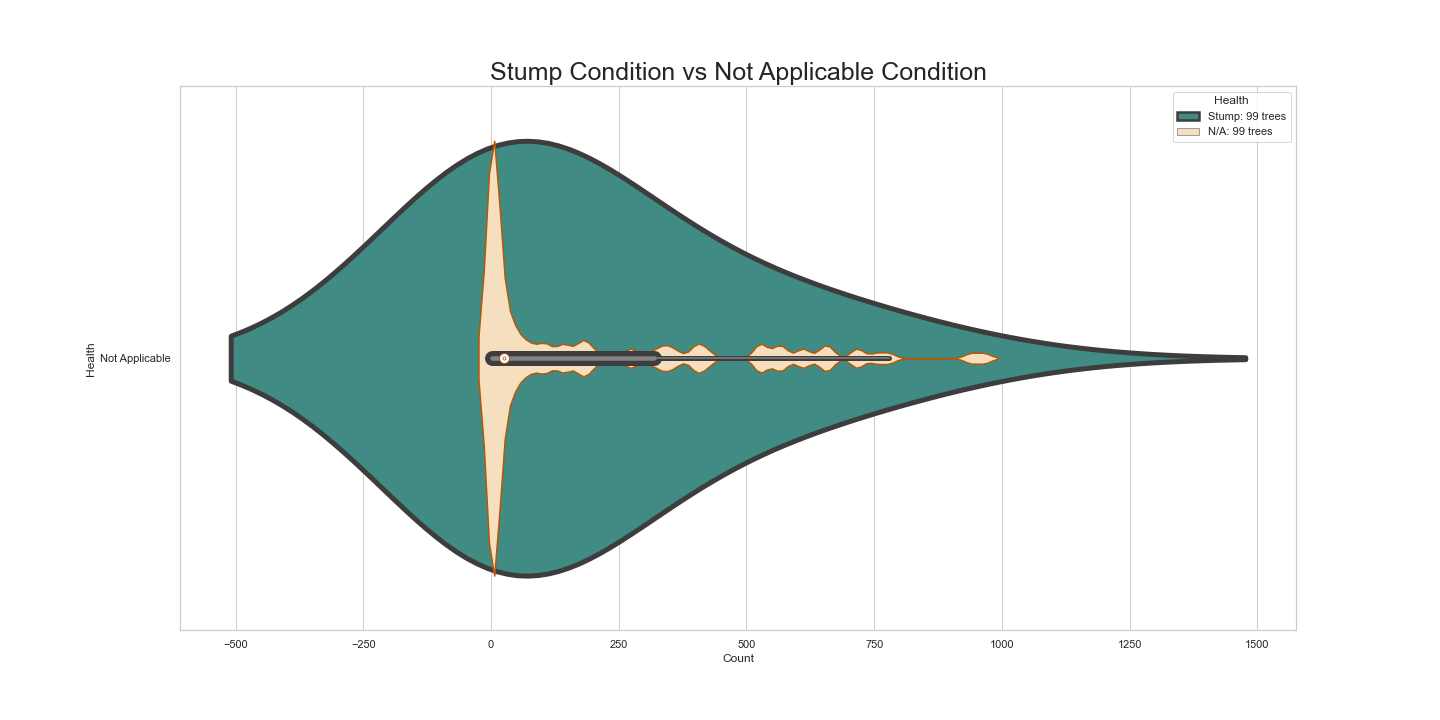
Finally, diameters in the "Not Applicable" category are more tightly clustered than in the "Stump" category, indicating potential consistency in this area of data collection. However, bins with maximum outliers suggest possible data errors or other issues requiring attention.

Overall, this data analysis provides valuable insights into the condition of street trees in the city, highlighting areas that may need additional attention and resources to ensure the health and vitality of these important urban assets.

Conclusion

The comprehensive street tree census conducted by NYC Parks & Recreation and partner organizations in 2015 offers crucial insights into the state of street trees in New York City. Although the majority of street trees are healthy, the findings underscore the need to improve and maintain trees in "Fair" and "Poor" condition. The data analysis also highlights potential root issues and variations in tree diameter measurements compared to stump diameter measurements. Further research can be conducted to investigate the underlying causes of these discrepancies and to establish effective strategies for managing and caring for street trees in the New York City area.


Within this comprehensive initiative, a series of carefully designed SQL queries were executed in SQL Server Management Studio 2018, representing a pivotal step in optimizing a dataset for enhanced performance. The dataset, sourced from AlexTheAnalyst on GitHub as part of the Data Analyst Portfolio Project, was downloaded onto an external thumb drive and systematically organized into folders. It consists of 19 columns and an impressive 56,477 rows, excluding the header. Key columns include UniqueID, ParcelID, and SaleDate.

ParcelID PropertyAddress ParcelID (nash2) PropertyAddress (nash2) MergedPropertyAddress
001 123 Main St 001 123 Main St
002 002 456 Oak St 456 Oak St
003 003 789 Pine St 789 Pine St
004 876 Maple St 004 876 Maple St
005 543 Elm St 005 543 Elm St

Upon the initial examination in Microsoft Excel, the dataset displayed 18 columns with a "General" data type, and one column was formatted as "Date (April 9, 2013)." Notably, all general columns were in uppercase, and the month names in the date column were presented in title case. A closer scrutiny of the SoldAsVacant column revealed responses such as No, N, Yes, and Y. Interestingly, several columns, including OwnerName, OwnerAddress, Acreage, TaxDistrict, LandValue, BuildingValue, TotalValue, YearBuilt, Bedrooms, FullBath, and HalfBath, contained a noteworthy number of null values.

UniqueID ParcelID PropertyAddress SalePrice SaleDate LegalReference RowNum
001 123456 789 Main St 250,000 2023-01-15 ABC123 2
002 789012 456 Oak St 300,000 2023-02-20 XYZ789 2
003 345678 123 Pine St 200,000 2023-03-10 LMN456 3
004 901234 876 Maple St 400,000 2023-04-05 PQR789 2
005 567890 543 Elm St 150,000 2023-05-12 STU012 3

During the transition to SQL Server, despite the absence of initial documentation on data types, null counts, or distinct value counts, the queries were adeptly organized into multiple files, categorized based on specific tasks. Following the cleansing process, the dataset retained 21 columns while maintaining its original 56,477 rows. A total of 26 meticulously crafted query statements were utilized in this endeavor, underscoring the analytical acumen and dedication invested in the project.


About

Hi, I'm Marcella, a junior data analyst in progress since May 2021. I'm passionate about Python, SQL, and R, aiming to unlock insights and help others. I love tackling challenges, finding unique solutions, and using data to tell compelling stories. Actively learning and collaborating, I'm confident that with dedication, I'll become a proficient data analyst.

Recent posts